
39% More Visits on 17% More Hours
Rocket Doctor AI just told us something about operating leverage that isn't in the headline. I bought more this morning.
Rocket Doctor AI Inc. (CSE: AIDR | OTC: AIRDF | FSE: 9390) September 14, 2026
I hold a material long position in Rocket Doctor AI, and I have a compensated advisory relationship with the company. Full disclosure at the bottom. Read it before you read anything else.
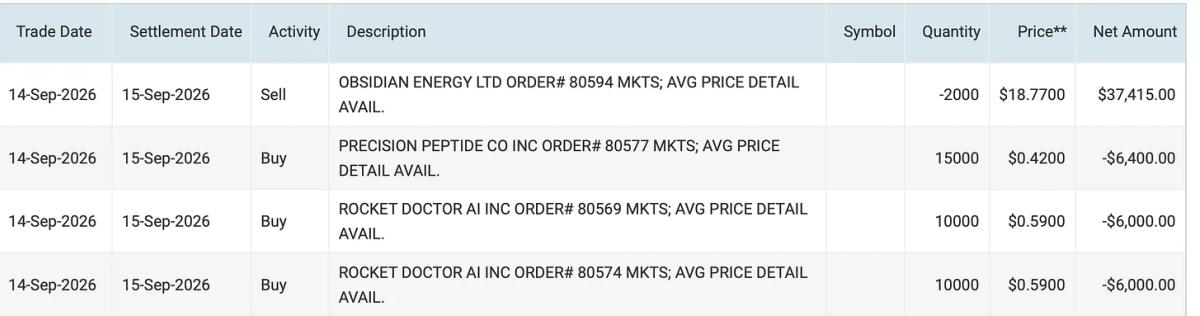
This morning, before the town hall, I added 20,000 shares at $0.59, two fills of 10,000 each, settling September 15. That’s on top of a position already north of 1.2 million shares. I’m not adding because the stock is cheap. I’m adding because of a ratio buried in a press release that most people will read as “nice, visits went up.”
What they actually said
Two numbers for July and August 2026, U.S. operations only:
- 3,625 completed patient visits over two months: 93% of what the entire three-month Q2 produced
- 1,555 clinical hours over two months: 78% of what the entire three-month Q2 produced
The number that isn’t in the headline
Volume grew more than twice as fast as the input required to produce it.
In Q2, a physician hour on this platform generated 1.97 completed visits. In July and August, it generated 2.33 completed visits. Same hour, 18.5% more output. Nearly five minutes came off the average encounter.
Under Rocket Doctor’s U.S. model, the company earns a fee per completed visit, not per hour. So revenue per physician hour just went up 18.5% without onboarding a single additional doctor, without a single new credentialing approval, without a dollar of incremental physician cost. That is the definition of operating leverage, and it is the single hardest thing for an early-stage healthcare platform to demonstrate.
It’s a curve, not a blip
Here is where the town hall deck earned its keep. Management disclosed U.S. clinical hours going back to Q4 2025, which gives us the denominator for every prior quarter. Run the ratio across the whole ramp:
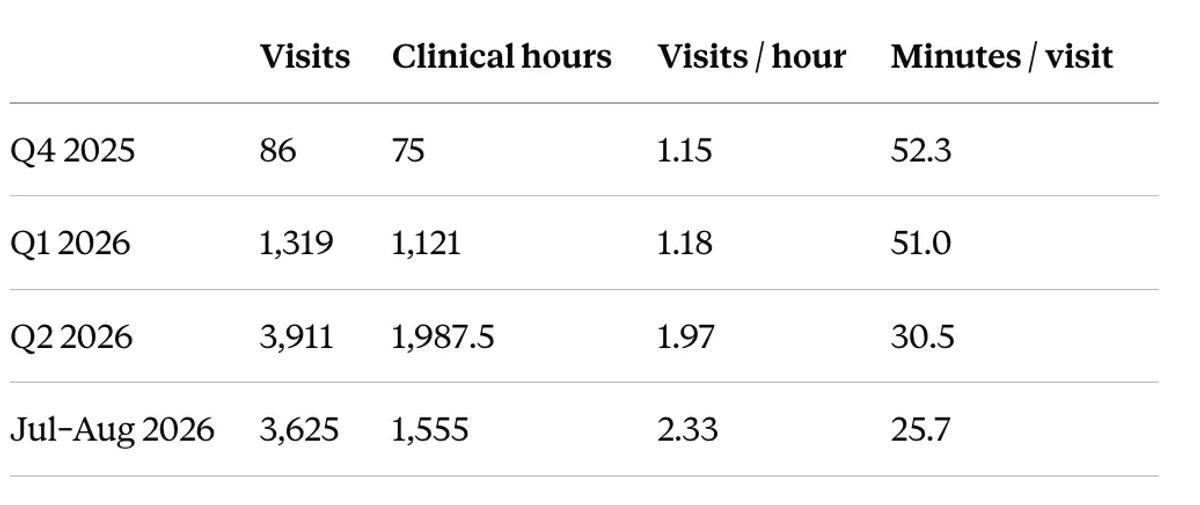
Fifty-two minutes per encounter down to twenty-six, over four quarters.
That matters because the obvious objection to a single two-month observation is that the case mix may have shifted toward shorter complaints. Case mix doesn’t drift in one direction for four consecutive quarters. Something structural is removing minutes from the encounter, most plausibly the AI triage and documentation layer doing what it was built to do, plus clinicians moving down a learning curve.
Two honest qualifications. The largest single step came in Q2 (+67%), not in the period just reported (+18.5%), so the rate of improvement is decelerating. And there is a floor here: 25.7 minutes is already within range of what a competent virtual primary care encounter takes, and no software gets you to eight. You cannot extrapolate this ratio forever.
Which is exactly why the next section matters. Once throughput flattens, growth has to come from hours, more doctors, or more hours from the doctors already there.
Nine months, 21x
Zoom out to the full U.S. ramp, December 2025 through August 2026:
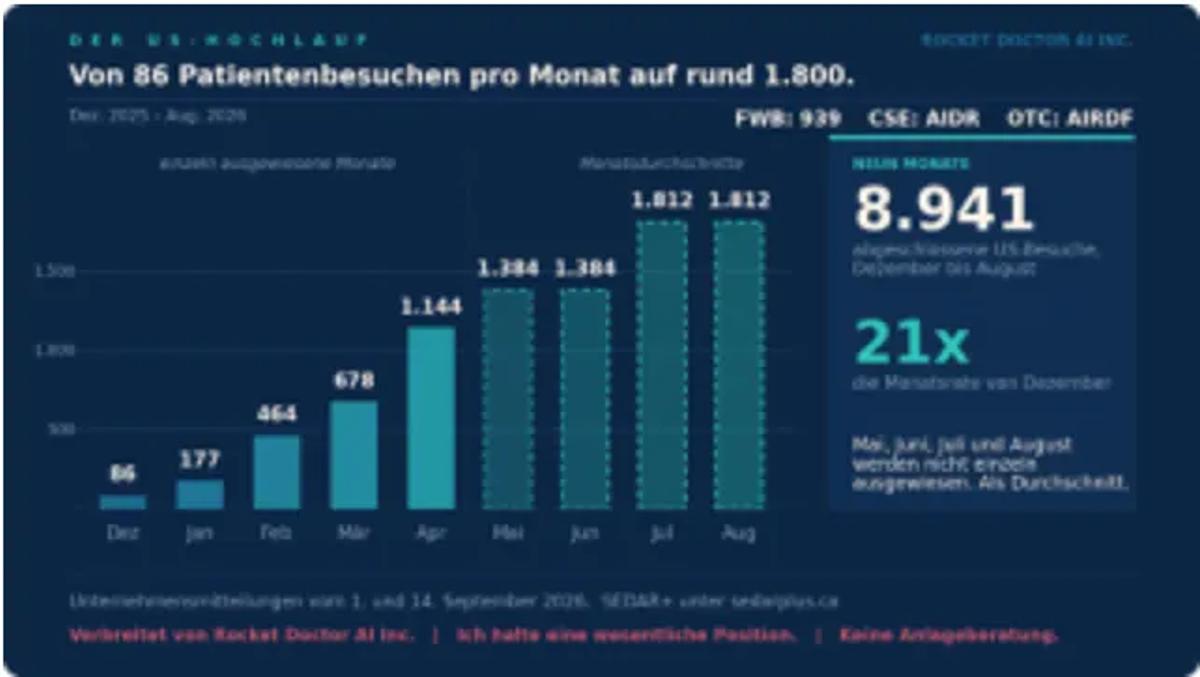
8,941 completed U.S. visits in nine months. The August monthly rate is 21 times December’s.
Zoom out to the full U.S. ramp, December 2025 through August 2026:
8,941 completed U.S. visits in nine months. The August monthly rate is 21 times December’s.
December 86 → January 177 → February 464 → March 678 → April 1,144 → May/June averaging 1,384 → July/August averaging 1,812.
(May, June, July and August are not individually disclosed and are shown at their period averages; they’re derived from the Q2 release of September 1 and today’s update. The chart comes from a fellow investor; the inputs are the company’s.)
Nine months ago this was a rounding error. It is now running at roughly 21,750 visits annualized if August simply holds and August did not look like a plateau.
The company’s own Q3 estimate is arithmetic, not optimism
The deck carries a Q3 2026 estimate of 5,438 visits on 2,332.5 clinical hours. Before anyone treats that as a forecast, check what’s inside it: 1,812.5 visits/month × 3 = 5,437.5. And 777.5 hours/month × 3 = 2,332.5.
It’s the July/August run rate multiplied by three. Nothing else. The implied throughput is 2.331 visits per hour, identical to the two months already reported, to three decimal places.
I’d rather investors understood that than mistook it for guidance. Management’s Q3 number assumes September merely matches August, that no further efficiency gain occurs, and that not one of the physicians currently in credentialing starts seeing patients. It is the floor of their own disclosed trend, not the ceiling.
The capacity argument nobody is making
Here’s what I find most interesting. At 778 clinical hours a month across 30 clinically active U.S. physicians, the average doctor on this platform is working six hours a week. The math comes to 5.99, which is almost funny.
Six. Hours. A week.
These doctors are not using Rocket Doctor as their practice. They’re using it as marginal capacity, evenings, weekends, gaps between shifts. Which means the growth path from here doesn’t strictly require winning new physicians. If average utilization moves from six hours a week to twelve, volume doubles with the existing network.
And that’s only the first lever. The town hall disclosed the physician funnel:
- 81 MDs signed across California, New York and Maryland
- 30 clinically active
- 51 in credentialing
Read that again. Only 37% of the doctors who have already signed are generating a single visit. The other 51 are sitting in payer queues. The company frames this as 3x capacity pending, and the arithmetic is fair: if all 81 were active at today’s utilization and throughput, you’d be looking at roughly 4,900 visits a month versus the 1,813 actually being produced.
Now, the caveat, because it’s a real one. Credentialing is slow, and the deck says so plainly: 0 to 120 days for Medicare and Medicaid, three to six months or longer for commercial payers, with each payer setting its own clock. That 3x is not a next-quarter event. It’s a Q4-26 to Q1-2027 event that is already paid for and already in motion. Meanwhile, as per last night’s webinar, demand from doctors to join the platform is only getting stronger, as every physician who wants to join pays 500USD to sign up and get credentialed.
Two independent levers, then: utilization of the active network, and conversion of the credentialing backlog. Neither requires new sales. Both are mechanical.
That is a fundamentally different growth constraint than the one most telehealth bulls underwrite. Credentialing infrastructure takes years to replicate. It’s built, and there’s a queue behind it.
Why your income statement won’t show any of this yet
Now the part the company spent three paragraphs on, and the part you need to actually absorb.
Rocket Doctor recognizes certain U.S. revenue on a cash basis. Not when the visit happens, but when the money arrives. The company draws a hard line between in-network patients (patient and physician both enrolled with the payer; claim is eligible) and out-of-network patients, where it has deliberately chosen to let people onto the platform to build adoption. It will submit those claims anyway, but it states plainly that reimbursement on out-of-network visits is generally not expected.
So let me say the thing a promoter wouldn’t: 3,625 visits is not 3,625 collected visits.Anyone multiplying visit counts by a per-visit fee and calling it revenue is doing arithmetic, not analysis.
What I’ll do instead is bracket it. On the per-visit economics as I understand them, roughly US$125 gross recognized per in-network visit, roughly US$100 flowing to the physician, leaving about US$25 net to the platform plus an 8% billing fee and EMR charges:
- Gross basis, fully collected: 21,750 annualized visits × US$125 ≈ US$2.7M ≈ C$3.7M
- Net-to-Rocket-Doctor basis: 21,750 × ~US$35 ≈ US$760K ≈ C$1.0M
Neither is a forecast. Both are ceilings that assume a 100% collection rate that will not happen. The real number sits somewhere below, and the variable that decides where is the in-network share of those 3,625 visits, which still has not been disclosed.
What the town hall did tell us about cash timing
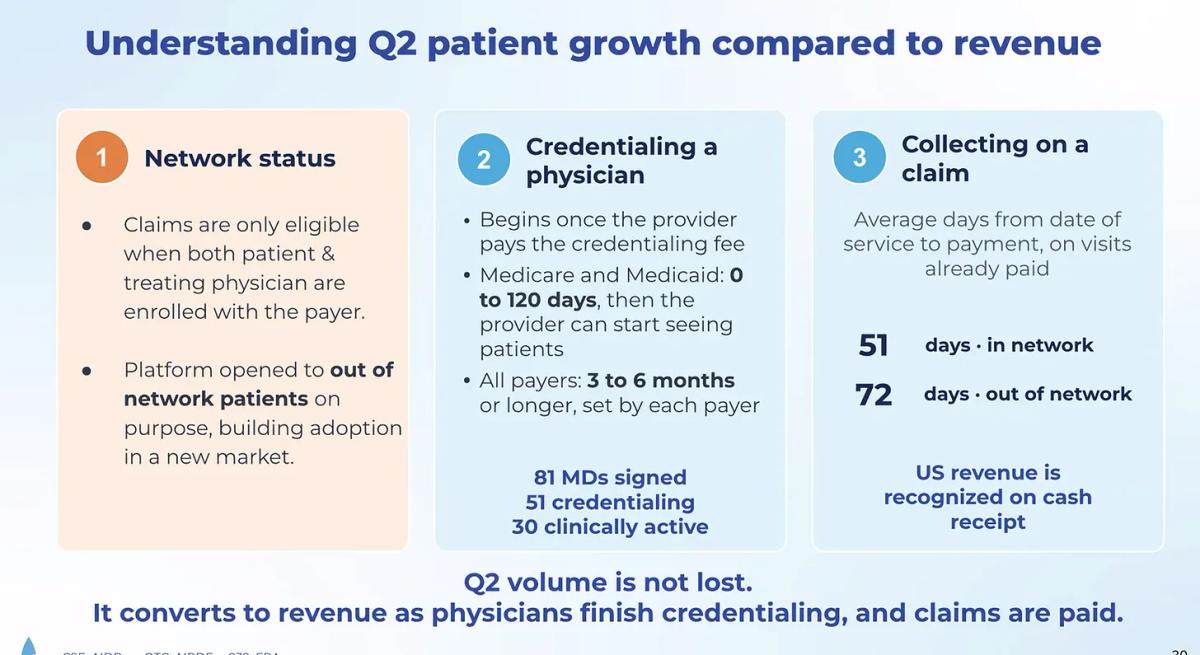
One number I’d been asking for showed up: average days from date of service to payment.
- 51 days — in network
- 72 days — out of network
That’s genuinely useful, and it converts a vague “lag” into a testable schedule. At 51 to 72 days, the July and August visits collect across September and October. Which means this volume lands in Q3 and Q4 reported revenue, not later. If those quarters don’t move, the lag thesis is wrong, and I’ll say so.
But read the footnote on that slide: those averages are measured on visits already paid. That’s a survivorship metric. It tells you how quickly the claims that cleared cleared. It tells you nothing about what share of submitted claims clear at all.
Speed of collection and rate of collection are different questions, and only one was answered. The company’s position- that Q2 volume isn’t lost, it converts as physicians finish credentialing and claims get paid- is the bull case stated by the party with the most to gain from it. It’s plausible, consistent with the disclosed mechanics, and not yet evidence. Q3 revenue is the evidence.
Two things worth holding onto anyway. First, the consolidation of the Practice Group grosses up both revenue and direct cost, so reported revenue will look larger and gross margin percentage will look worse as the U.S. scales. That’s accounting geometry, not deterioration. Second, on a net basis, a U.S. visit contributes roughly four times what a Canadian visit does (~US$25+ vs ~C$8–9). Mix shift toward the U.S. is accretive to net economics even while it optically compresses margin.
What you’re actually underwriting
Let’s be clear about what this is. Rocket Doctor is a roughly US$40M company building payer infrastructure in the world's largest healthcare market. Q2 revenue was $734,028, up 43% year over year.
If you’re screening for profitability, you’re in the wrong aisle. Nobody underwrites a company at this stage on trailing multiples, and in this case a sales multiple is actively misleading; reported revenue lags the operating business by a full collection cycle. Judging it on the number that hasn’t caught up yet is the mistake, not the analysis.
What you are underwriting is narrow: that the visit ramp converts to cash, and that the credentialing asset gets utilized. Here’s what can break that.
The risks I’m carrying:
- Capital. This company will raise every company again at this stage does. The question is timing: a raise that lands after the collection ramp is visible is a very different event than one that lands before it.
- Supply overhang. ~3.4M escrow shares release December 9, 2026, about six weeks ahead of ~7.4M warrants at $0.85 expiring January 22, 2027. The supply from the prior unlock, which happened on August 9 for 3.4M shares, is exactly why I can buy more of this business at such a low valuation.
What would prove me wrong
I publish these because a thesis you can’t falsify isn’t a thesis:
- Q3 visits come in below Q2. The ramp was momentum from mid-Q2 onboarding, not a new baseline.
- Throughput reverses. Clinical hours grow faster than visits again next quarter, meaning the 18.5% gain was case-mix noise, not workflow improvement.
- Q3 collected U.S. revenue doesn’t move materially. Two months at 93% of a full quarter’s volume should eventually hit cash. If Q3 and Q4 U.S. revenue stay flat, the cash-basis lag isn’t a lag, it’s a collection failure.
- In-network share stalls or falls. If the visit growth is overwhelmingly out-of-network, the volume chart is a user-acquisition chart, not a revenue chart.
- Excessive dilution before Q3 results (more than 5MUSD)
The position
The questions that are still open
I went into the town hall with four. One and a half came back answered.
Answered: average days from service to payment, 51 in-network, 72 out. And the physician funnel: 81 signed against 30 active, which I’d been guessing at from the Q2 clinician count.
Still open, and these are the ones that decide the thesis:
- Of the 3,625 visits, how many were in-network? This remains the single most important undisclosed number in the story. Volume without payer mix is a numerator without a denominator.
- What is the collection rate on submitted claims, not the speed on the ones that paid, but the percentage that pay at all? In-network and out-of-network, separately.
- What drove minutes-per-visit from 52 to 26? How much is the AI layer versus the learning curve? The answer determines whether the curve continues or flattens here.
- What moves the active physician from six hours a week to twelve? Is there a plan, or is utilization simply whatever the doctors feel like giving?
I’d add a fifth after seeing the deck: how does the 5M+ in-network reach from the new California value-based agreement relate to the ~24M covered lives already claimed? If they overlap, adding them would badly overstate the network. I’m not assuming either way until someone says.
The position
I bought 20,000 shares on Monday morning at $0.59, before the town hall. I funded part of it by trimming an unrelated energy position. That’s not a signal about anything other than my own conviction, and my conviction is not evidence.
What I’m underwriting is narrow and specific: a company whose physicians now complete an encounter in 26 minutes instead of 52, with 51 more doctors sitting in credentialing queues behind the 30 currently working, at six hours a week each. The income statement will be the last place this shows up. That’s precisely why there’s a price to be had before it does.
If the in-network mix comes back strong, I’ll add again. If September flattens, I’ll tell you that too.
One more thing from the deck, which I’m holding for a separate piece. Rocket Doctor signed its first value-based primary care agreement with a California independent physician association, an assigned patient panel paid per member per month, on top of per-visit fees. That is a different revenue model than everything discussed above: recurring, beginning before a patient books, with volume that arrives through the plan rather than through paid acquisition. It deserves more than a paragraph at the bottom of somebody else’s article. I’ll write it up properly.
DISCLOSURE
I hold a material long position in the securities discussed, over 1.2 million shares, and I purchased an additional 20,000 shares at $0.59 on September 14, 2026. I may buy or sell at any time without notice. This is a paid relationship, and I am not independent. Read everything above with that in mind.
This communication is disseminated in accordance with Section 17(b) of the U.S. Securities Act of 1933 and Canadian National Instrument 51-102. It is for informational purposes only, is not investment advice, and is not a recommendation to buy or sell any security. I am not a registered investment adviser, broker, or dealer in any jurisdiction.
Rocket Doctor AI is a micro-cap issuer. It is unprofitable, cash-flow negative, carries convertible debt, and will likely require additional financing. Micro-cap securities are illiquid, volatile, and can lose their entire value. Do your own work and consult a licensed professional before making any investment decision.
Analyst coverage conflicts: Maxim Group maintains a Buy rating with a C$3.00 target and makes a market in the stock.
Sources: Rocket Doctor AI news releases dated September 1, 2026 and September 14, 2026; interim financial statements and MD&A filed on SEDAR+ (www.sedarplus.ca) and yesterday’s webinar. Per-visit economics, monthly visit derivations, throughput calculations, run-rate annualizations, market capitalization and USD/CAD conversion (1.37) are my own estimates and arithmetic, not company guidance. Share count is approximate; verify against the latest filing.
Forward-looking statements: This piece contains forward-looking statements regarding future visit volumes, revenue recognition, collection rates and capital requirements. These are not guarantees. Actual results may differ materially. The company undertakes no obligation to update them, and neither do I.
This article reflects personal research and opinions and is provided for informational purposes only. It is not financial advice, a recommendation to buy or sell any security, or a consideration of your individual circumstances. Investing in small-cap and pre-commercialization companies involves significant risk, including the risk of total loss. Always do your own research and consider speaking with a qualified financial professional before making investment decisions.
Stay Informed with The Wire
Get the latest insights and analysis on public companies delivered directly to your inbox.